Logging Responses in Preview Mode
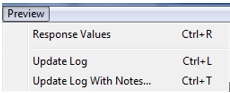
Data entered in a preview session can be saved to the log file (updated) at any point during the preview session by either using keyboard shortcut Ctrl+L, selecting Preview|Update Log from the menu bar (CAPI only), or selecting the Update Log button on the Response values box. QDS will notify you that "Response Values have been added to log file".
Tip: Every time you update the log, a new row of response values, separated by commas, is added to the log file. For cases where a tracked variable doesn’t have any response data, a blank space will be written to the log file.
Log Testing Notes
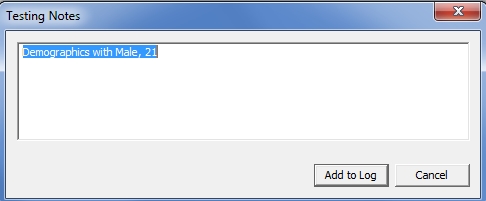
You may add an optional note to the end of a row of response data by using Ctrl+T, selecting Preview|Update Log With Notes from the menu bar (CAPI only), or selecting the Update Log with Notes button on the Response values box. When you Update Log with Notes, the log is updated and text entered into the Testing Notes box is added to the Notes column at the end of the row of data (see Log Spreadsheet Data). QDS will notify you that "Response Values and notes have been added to log file".
Logged Data Example
If you had a survey named "Health Study" and wanted to test and review data entered for specific variables in your tobacco section, you could do this with the Preview data logging.
- Under Options|Preview from the Design Studio menu, Log tab, check the Produce preview session log box.
- Enter Directory for log files.
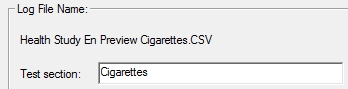
- Name your log file "Health Study En Preview Cigarettes.CSV" by entering "Cigarettes" into Log File Name: Test section box.
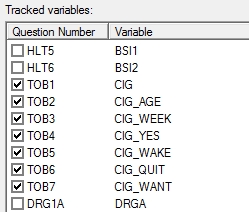
- Under tracked variables, select only the variables in the Tobacco section you want to test (e.g., CIG to CIT_WANT).
- Click OK to return to the Design Studio element listing.
- Highlight the elements you would like to test (this can include any number of elements, not just those selected in tracked variables).
- Select Tools|Preview or F5 to launch Preview.
- During your Preview session, select Preview|...Update Log (Ctrl+L) or Update Log with Notes (Ctrl+T), or select the Update Log/Update Log with Notes button on the Response values box to save data for tracked variables entered so far into the log file.
- Add successive rounds of test data to the log by either:
- Entering data in successive Preview sessions and update log data at end. Each separate session will be a separate row in a single logged data file until you rename the log file.
- Going "back and forth" during a single preview session using the Previous Question and Next Question buttons and select to update the log data every time you would like to start a new row of data.
After you exit the Preview session, the .CSV log file will be saved into the folder specified under log options for Directory for the log file.
CSV Log Data
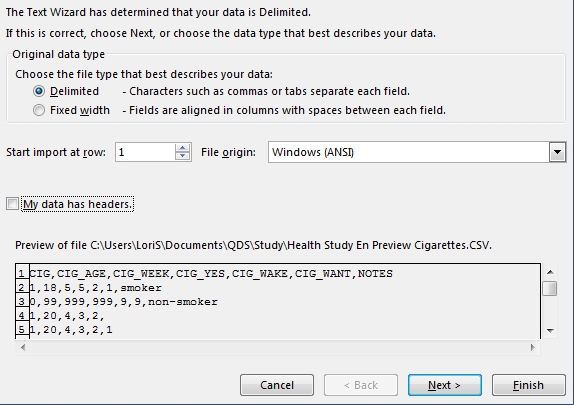
You can open the .CSV file in any spreadsheet program. The steps for importing to MS Excel would be as follows (this may differ depending upon version):
- Open the .CSV file (the spreadsheet program may automatically detect that the file is text delimited and prompt you to specify details about importing it).
- Highlight the first column.
- Go to Data|Text to Columns .
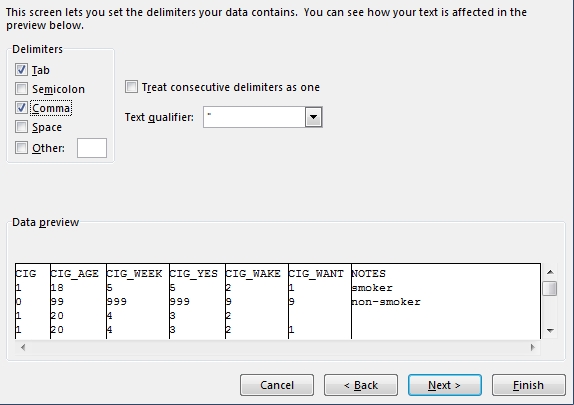
- Select the Delimited radio button, then select Next.
- Select the delimiters: Tab and Comma; the Data preview should show your data lined up in columns. Select Next.
- Select additional options and Finish.
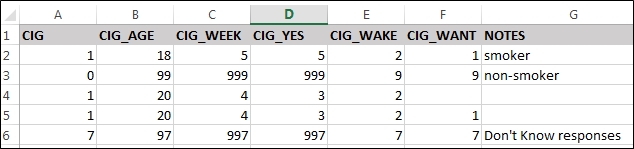
Log Spreadsheet Data
The logged data is presented in columns with each variable's data in a column in survey order (component variables![]() A component variable is one part of a composite variable. Check Each, ranking, date, time, and time span response types all have composite and component variables. A Check Each component represents whether or not a response was selected. A ranking component represents the rank selected. A date, time, or time span component represents that part of the whole date or time, such as year, month, weeks, hour or minute. at the end of the listing); the Notes column is presented as the last column if any notes were entered.
A component variable is one part of a composite variable. Check Each, ranking, date, time, and time span response types all have composite and component variables. A Check Each component represents whether or not a response was selected. A ranking component represents the rank selected. A date, time, or time span component represents that part of the whole date or time, such as year, month, weeks, hour or minute. at the end of the listing); the Notes column is presented as the last column if any notes were entered.
Tip: Data does not include labels and special codes are presented as their numeric codes.